Displaying interactive MS Chart objects in ASP.NET MVC
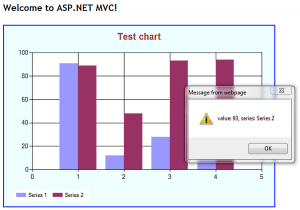
Displaying charts using MS Chart is usually simple in asp.net webform. The problem exists if we want to use it in Asp.net MVC application without putting it on .aspx page. In this article I will show you how to display interactive chart using purely MVC view.
Lets start with creating ChartHelper class that will contain basic logic for creating chart objects. In the function CreateDummyChart() we will just create standard MS Chart object with some dummy data.
 public static Chart CreateDummyChart()
 {
    var chart = new Chart() { Width = 600, Height = 400 };
    chart.Palette = ChartColorPalette.Excel;
    chart.Legends.Add(new Legend("legend1") { Docking = Docking.Bottom });

    var title = new Title("Test chart", Docking.Top, new Font("Arial", 15, FontStyle.Bold), Color.Brown);
    chart.Titles.Add(title);
    chart.ChartAreas.Add("Area 1");

    chart.Series.Add("Series 1");
    chart.Series.Add("Series 2");

    chart.BackColor = Color.Azure;
    var random = new Random();

    //add random data: series 1
    foreach (int value in new List<int>() { random.Next(100), random.Next(100), random.Next(100), random.Next(100) })
    {
        chart.Series["Series 1"].Points.AddY(value);

        //attach JavaScript events - it can also be ajax call
        chart.Series["Series 1"].Points.Last().MapAreaAttributes = "onclick=\"alert('value: #VAL, series: #SER');\"";
    }

    //add random data: series 2
    foreach (int value in new List<int>() { random.Next(100), random.Next(100), random.Next(100), random.Next(100) })
    {
        chart.Series["Series 2"].Points.AddY(value);

        //attach JavaScript events - it can also be ajax call
        chart.Series["Series 2"].Points.Last().MapAreaAttributes = "onclick=\"alert('value: #VAL, series: #SER');\"";
    }

    return chart;
 }
Next, we need to create function that takes our newly created chart object and saves it to memory stream. After that we only need to convert the stream to byte array and to base64 string afterwards.
Having image string created, we simply construct html “img” tag to be rendered by our view. Please note that “data:image/png;base64” attributes are necessary to tell the browser to render it as image.
 public static string GetChartImageHtml(Chart chart)
 {
    using (var stream = new MemoryStream())
    {
        var img = "<img src='data:image/png;base64,{0}' alt='' usemap='#" + ImageMap + "'>";

        chart.SaveImage(stream, ChartImageFormat.Png);

        var encoded = Convert.ToBase64String(stream.ToArray());

        return string.Format(img, encoded);
    }
 }
The final thing is to create DisplayChart() method in the view to be used by Html.RenderAction. Apart from chart’s image string, we also need to display chart’s image map in order to enable chart JavaScript events when needed.
public ActionResult DisplayChart()
{
    var chart = ChartHelper.CreateDummyChart();

    var result = new StringBuilder();
    result.Append(ChartHelper.GetChartImageHtml(chart));
    result.Append(chart.GetHtmlImageMap(ChartHelper.ImageMap));

    return Content(result.ToString());
}
And finally this is our view
@{
    ViewBag.Title = "Home Page";
}

<h2>@ViewBag.Message</h2>

@{ Html.RenderAction("DisplayChart"); }
I have attached project files to save your time 🙂

