Auto publishing reports to Tableau Server

Tableau it’s a great tool for data visualization, however if you are using it a lot, you may want to automate some stuff. One of them is publishing/updating reports to Tableau Server. This is when Tableau Utility Command comes in handy, you can install it on your development server and use in the power-shell script. One of the solutions is to use CI server for auto deployments, you only need to give the git/svn access for users changing the reports or adding new ones.

tableau

Following script can be run as build step in TeamCity to detect workbooks that have been changed recently and publish them automatically to Tableau server. Parent folder of each workbook will be used as project name when publishing. In order to run it, just pass in email notification list and server password – of course you need to configure the params (server url, smtp etc.).

param (
[string]$cmddir = "C:\Program Files\Tableau\Tableau Server\8.2\extras\Command Line Utility", #location where tabcmd has been installed
[string]$server = "https://tableau:81", #this is url of the Tableau server 
[string]$currentDir = (split-path -parent $MyInvocation.MyCommand.Definition) +"\", #current script location
[string]$notificationEmailList = "test1@test.com,test2@test.com", #send email notifications if successful
[string]$admin = "user", #admin account for the server
[string]$pass = "" #to be passed in as param
)
 
function SendEmail($emailTo,$title,$body)
{ 
   $smtp=new-object Net.Mail.SmtpClient("my_smtp_server"); $smtp.Send("sentAs@mydomain.com", $emailTo, $title, $body);
}
 
$global:temp_ = "";
 
#login to Tableau
cd  $cmddir
.\tabcmd login -s $server -u $admin -p $pass
 
 get-childitem -Path $currentDir –recurse |  where-object { 
    $_.LastWriteTime -gt (get-date).AddMinutes(-10) -and $_.FullName.EndsWith(".twb")
  } | 
  Foreach-Object {
 
       [string]$projectName = [System.IO.DirectoryInfo]$_.Directory.Name;
        $global:temp_ += [string][System.IO.Path]::GetFileName($_.FullName) + " | ";
 
       #publish or overwrite workbook on the server
       .\tabcmd publish $_.FullName -r $projectName  -o  
  } 
 
 
#more commands
#.\tabcmd publish "workbook.twbx" -r "project name" -n "Workbook Name" --db-user "" --db-password "" -o
 
 
#log out to release the session
.\tabcmd logout
 
if(-not $global:temp_ -eq "")
{
   SendEmail $notificationEmailList "Tableau report published" "Following report(s) has just been successfully published to Tableau Server: $global:temp_"
}

enjoy!

1 Star2 Stars3 Stars4 Stars5 Stars (No Ratings Yet)
Loading...Loading...

Social media Sentiment Analysis using C# API

Sentiment Analysis in Social media has become very important for many companies over the last few years as more and more people use this communication channel not only to exchange the messages, but also to express their opinions about the products and services they use or used in the past.

In order to start proper sentiment analysis, we need to use correct Text Analytics and Text Mining techniques. The fastest way is to use external API to get the information we need and then import that data on the daily basis to our system database, where we can visualize and track the results.

In this article I will show you, how you can convert unstructured data e.g. tweets using text2data.org API, into structured information that you can use to track sentiment towards the brand, product or company.

First step is to register in the service and get the private key to be used in your API calls. Next, you need to download API SDK from here

The code below, will just create request object containing your information and post that to platform using json or xml format. The response object will have information you need: Detected Entities, Themes, Keywords, Citations, Slang words and abbreviations. For each of these you can get sentiment result as double, polarity and score (positive, negative or neutral). Received information can be formatted the way you want. Below is complete sample (except for private key):

  static void Main(string[] args)
   {
        var inputText = "I am not negative about the LG brand.";
        var privateKey = "-------------"; //add your private key here (you can find it in the admin panel once you sign-up)
        var secret = ""; //this should be set-up in admin panel as well.

       var doc = new Document()
       {
          DocumentText = inputText,
          IsTwitterContent = false,
          PrivateKey = privateKey,
          Secret = secret
       };

       var docResult = API.GetDocumentAnalysisResult(doc); //execute request

       if (docResult.Status == (int)DocumentResultStatus.OK) //check status
       {
        //display document level score
        Console.WriteLine(string.Format("This document is: {0}{1} {2}", docResult.DocSentimentPolarity, docResult.DocSentimentResultString, docResult.DocSentimentValue.ToString("0.000")));

        if (docResult.Entities != null && docResult.Entities.Any())
        {
         Console.WriteLine(Environment.NewLine + "Entities:");
         foreach (var entity in docResult.Entities)
         {
           Console.WriteLine(string.Format("{0} ({1}) {2}{3} {4}", entity.Text, entity.KeywordType, entity.SentimentPolarity, entity.SentimentResult, entity.SentimentValue.ToString("0.0000")));
          }
       }
 
      if (docResult.Keywords != null && docResult.Keywords.Any())
      {
         Console.WriteLine(Environment.NewLine + "Keywords:");
         foreach (var keyword in docResult.Keywords)
          {
             Console.WriteLine(string.Format("{0} {1}{2} {3}", keyword.Text, keyword.SentimentPolarity, keyword.SentimentResult, keyword.SentimentValue.ToString("0.0000")));
            }
        }

        //display more information below if required 

      }
      else
      {
          Console.WriteLine(docResult.ErrorMessage);
      }

       Console.ReadLine();
  }

You can always validate results by checking the demo site (on text2data.org platform)

sentiment-analysis

Enjoy 🙂

Social-Media-Icons

1 Star2 Stars3 Stars4 Stars5 Stars (1 votes, average: 5.00 out of 5)
Loading...Loading...

Displaying dynamic javascript charts using MVC

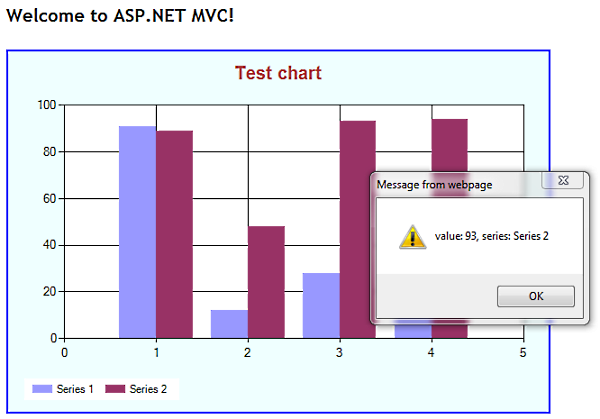
When creating business solutions there is often a need to display dynamic JavaScript charts using specific entity data that can be easily extended throughout the system. Properly designed system should always provide clear separation between business entities and UI layer. When using JavaScript this separation can be easily neglected.
In this article I will show you how to use entity oriented approach when mixing C# and JavaScript code.

In order to do that we will create JavaScript api that will be used to call web controllers such as clientController, productController, userController etc. Each of these controllers will provide us entity related data that can be displayed on the web pages throughout the system. The data will be sent using json protocol along with the target chart configuration we want.

jschart_line

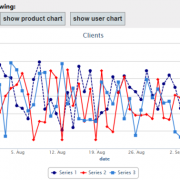
In order to display above charts within our application, we need to simply create div tag that will serve as a placeholder for our chart, we also need to assign attributes and “chartButton” class name to the element that will trigger chart display. The attributes will contain entity name e.g. data-entity=”client”, chart placeholder e.g. targetdiv=”chart1Div” and optionally data parameters e.g. params=”clientId=?&fullInfo=?”

  <input type="button" value="show client chart" class="chartButton" data-entity="client" data-params="clientId=@ViewBag.ClientId&fullInfo=true" data-targetdiv="chart1Div" />
  <input type="button" value="show product chart" class="chartButton" data-entity="product" data-targetdiv="chart1Div" />
  <input type="button" value="show user chart" class="chartButton" data-entity="user" data-targetdiv="chart1Div" />
  <div id="chart1Div"></div>

We also need to add following script references to our _Layout.cshtml file. In our case we will use HighCharts, hence reference to highcharts.js script (we are not limited only to this control, you can convert it to use other JavaScript chart controls as well if needed). The file chartAPI.js will contain our main logic that connects Web Api controllers and JavaScript code.

   <script src="https://code.highcharts.com/highcharts.js" type="text/javascript"></script>
   <script src="@Url.Content("~/Scripts/chartAPI.js")" type="text/javascript"></script>

Let’s start implementation from creating Web Api entity controllers and chart data dto object that will transfer the chart data and it’s configuration.

The ChartData class will contain chart series and chartConfig object – it can be extended at any time depending on our requirements.

   public class ChartData
   {
        public ChartConfig ChartConfig { get; set; }
        public List<Series> Series { get; set; }
    }

    public class Series
    {
        public string Name { get; set; }
        public string Color { get; set; }
        public string DashStyle { get; set; }      
        public List<PointData> Points { get; set; }
    }

    public class PointData
    {
        public DateTime Date { get; set; }
        public double Value { get; set; }
    }

    public class ChartConfig
    {
        public ChartConfig()
        {
            tooltipPointFormat = "";
        }

        public string chartTitle { get; set; }
        public string defaultSeriesType { get; set; }
        public int width { get; set; }
        public int height { get; set; }
        public string tooltipPointFormat { get; set; }
        public bool pie_allowPointSelect { get; set; }
        public bool pie_dataLabelsEnabled { get; set; }
        public bool pie_showInLegend { get; set; }   
    }

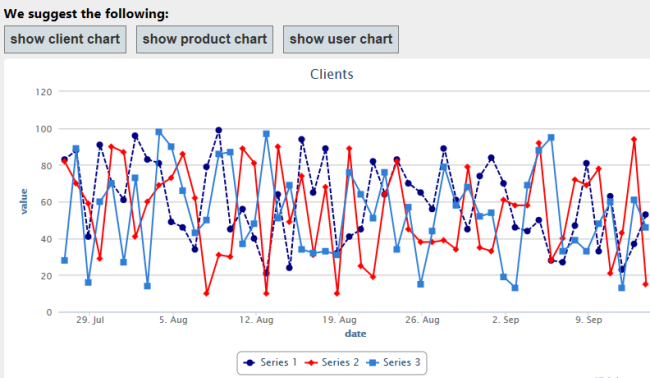
Having above classes created, we can now use it to fill it with dummy data inside our entity controller. We can add as many series as we like, we may also configure desired chart’s width, height, series colors etc. Please note that controller’s method will be mapped based on defined html params (see above html configuration).

 public string Get(int clientId, bool fullInfo = true)
 { 
    var data = new ChartData();

    //configure chart
    data.ChartConfig = new ChartConfig()
    {
        chartTitle = "Clients",
        defaultSeriesType = "line",
        width = 800,
        height = 400,
    };

    #region add series
    data.Series = new List<Series>();

    data.Series.Add(new Series()
    {
        Name = "Series1",
        Color = ColorTranslator.ToHtml(Color.Navy),
        DashStyle = "ShortDash",
        Points = new List<PointData>()
    });

    data.Series.Add(new Series()
    {
        Name = "Series2",
        Color = ColorTranslator.ToHtml(Color.Red),
        Points = new List<PointData>()
    });

    data.Series.Add(new Series()
    {
        Name = "Series3",
        Points = new List<PointData>()
    });

    #endregion

    #region add dummy data
    var random = new Random();
    foreach (var serie in data.Series)
    {
        for (var i = 0; i < 50; i++)
        {
            serie.Points.Add(new PointData()
            {
                Date = DateTime.Now.AddDays(-i),
                Value = random.Next(10, 100)
            });
        }
    }
    #endregion

    var json = JsonHelper.ToJSON<ChartData>(data);

    return json;
}

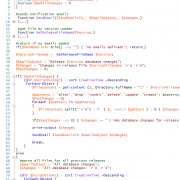
Our chartAPI.js file will contain main JavaScript logic encapsulating data retrieval and constructing the chart object. The function getEntityData simply calls appropriate entity controller using $.getJSON function. When data is retrieved, the renderChart function is used to create chart object, fill it with data and configure according to obtained configuration.

 //this function is used by UI to trigger chart display
$(document).ready(function () {
    //process data on button click
    $(".chartButton").click(function (sender) {

        //read button attributes
        var entity = $(this).attr("data-entity");
        var targetDiv = $(this).attr("data-targetDiv");
        var params = $(this).attr("data-params");

        //call encapsulated function
        getEntityData(entity, params, function (data, status, response) {
            if (status === "success") {
                renderChart(data, targetDiv);
            }
            else if (status === "error") {
                //process the error here if needed

                alert('An error occurred: ' + response);
            }
            else if (status === "complete") {
                //attach your load completed events here if needed

                //alert('Data loaded!');
            }
        });
    });
});

//Gets data for the entity
//This function is encapsulated 
function getEntityData(entityName, params, callbackFn) {
    if (typeof callbackFn != 'function') {
        alert('Incorrect callback function attached!'); return;
    }

    //make sure correct path is set
    var root = location.protocol + "//" + location.host;

    $.getJSON(root + '/API/' + entityName + "?" + params, null)
    .success(function (data, status, response) {
        //create object from json
        var resultObject = JSON.parse(data);
        callbackFn(resultObject, status, response);
    })
    .error(function (e, status, response) {
        callbackFn(e, status, response);
    })
    .complete(function (e, status, response) {
        callbackFn(e, "complete", response);
    });
}

//Renders chart
function renderChart(data, renderTo) {
    var chart1 = new Highcharts.Chart({
        chart: {
            renderTo: renderTo,
            defaultSeriesType: data.ChartConfig.defaultSeriesType,
            width: data.ChartConfig.width,
            height: data.ChartConfig.height,
        },
        title: {
            text: data.ChartConfig.chartTitle,
        },
        tooltip: {
         pointFormat: data.ChartConfig.tooltipPointFormat,
        },
        plotOptions: {
                pie: {
                    allowPointSelect: data.ChartConfig.pie_allowPointSelect,
                    cursor: 'pointer',
                    dataLabels: {
                        enabled: data.ChartConfig.pie_dataLabelsEnabled,
                    },
                    showInLegend: data.ChartConfig.pie_showInLegend,
                },
            },
        xAxis: {
            title: {
                text: 'date'
            },
            type: 'datetime',
        },
        yAxis: {
            title: {
                text: 'value'
            }
        },
    });

    $.each(data.Series, function (index, item) {
        //add series
        chart1.addSeries({
            name: item.name,
            dashStyle: item.DashStyle,
            color: item.Color,
            data: []
        }, false);

        //add data points
        $.each(item.Points, function (index, pointData) {
            chart1.series[chart1.series.length - 1].addPoint([
                Date.parse(new Date(parseInt(pointData.Date.substr(6)))),//format date
                pointData.Value,
            ], false);
        });
    });

    chart1.redraw();
}

It is more than certain that you will have to adjust above solution to your specific requirements. At the same time it should give you a good starting point to implement your own solution based on this example.

I have attached project files below for your convenience.

jsChartMVC

1 Star2 Stars3 Stars4 Stars5 Stars (1 votes, average: 4.00 out of 5)
Loading...Loading...

Displaying interactive MS Chart objects in ASP.NET MVC

Displaying charts using MS Chart is usually simple in asp.net webform. The problem exists if we want to use it in Asp.net MVC application without putting it on .aspx page. In this article I will show you how to display interactive chart using purely MVC view.

mschart_mvc

Lets start with creating ChartHelper class that will contain basic logic for creating chart objects. In the function CreateDummyChart() we will just create standard MS Chart object with some dummy data.

 public static Chart CreateDummyChart()
 {
    var chart = new Chart() { Width = 600, Height = 400 };
    chart.Palette = ChartColorPalette.Excel;
    chart.Legends.Add(new Legend("legend1") { Docking = Docking.Bottom });

    var title = new Title("Test chart", Docking.Top, new Font("Arial", 15, FontStyle.Bold), Color.Brown);
    chart.Titles.Add(title);
    chart.ChartAreas.Add("Area 1");

    chart.Series.Add("Series 1");
    chart.Series.Add("Series 2");

    chart.BackColor = Color.Azure;
    var random = new Random();
    
    //add random data: series 1
    foreach (int value in new List<int>() { random.Next(100), random.Next(100), random.Next(100), random.Next(100) })
    {
        chart.Series["Series 1"].Points.AddY(value);

        //attach JavaScript events - it can also be ajax call
        chart.Series["Series 1"].Points.Last().MapAreaAttributes = "onclick=\"alert('value: #VAL, series: #SER');\"";
    }

    //add random data: series 2
    foreach (int value in new List<int>() { random.Next(100), random.Next(100), random.Next(100), random.Next(100) })
    {
        chart.Series["Series 2"].Points.AddY(value);

        //attach JavaScript events - it can also be ajax call
        chart.Series["Series 2"].Points.Last().MapAreaAttributes = "onclick=\"alert('value: #VAL, series: #SER');\"";
    }

    return chart;
 }

Next, we need to create function that takes our newly created chart object and saves it to memory stream. After that we only need to convert the stream to byte array and to base64 string afterwards.

Having image string created, we simply construct html “img” tag to be rendered by our view. Please note that “data:image/png;base64” attributes are necessary to tell the browser to render it as image.

 public static string GetChartImageHtml(Chart chart)
 {
    using (var stream = new MemoryStream())
    {
        var img = "<img src='data:image/png;base64,{0}' alt='' usemap='#" + ImageMap + "'>";

        chart.SaveImage(stream, ChartImageFormat.Png);

        var encoded = Convert.ToBase64String(stream.ToArray());

        return string.Format(img, encoded);
    }
 }

The final thing is to create DisplayChart() method in the view to be used by Html.RenderAction. Apart from chart’s image string, we also need to display chart’s image map in order to enable chart JavaScript events when needed.

public ActionResult DisplayChart()
{  
    var chart = ChartHelper.CreateDummyChart();
   
    var result = new StringBuilder();
    result.Append(ChartHelper.GetChartImageHtml(chart));
    result.Append(chart.GetHtmlImageMap(ChartHelper.ImageMap));

    return Content(result.ToString());
}

And finally this is our view

@{
    ViewBag.Title = "Home Page";
}

<h2>@ViewBag.Message</h2>

@{ Html.RenderAction("DisplayChart"); }

I have attached project files to save your time 🙂

mschart-mvc

1 Star2 Stars3 Stars4 Stars5 Stars (No Ratings Yet)
Loading...Loading...

Using automation for gathering release changes

If you need to gather release changes when creating installers, the script below can help you. Script simply gets all or current database release changes stored in file. I use it to automatically gather the latest changes after TeamCity builds release installer. The changes could be sent to PR for documentation. You can of course use more complicated patterns when extracting script text when required. To execute it, just pass in update script location, version number and email addresses.

release_changes


 param (
 [string]$ScriptFolder = "C:\Database\Updates",
 [string]$Version = "2.11.0.0",
 [string]$SendEmailsTo = "test@test.com",
 [boolean]$GetAllChanges = 0
)

#sends notification emails
 Function SendEmail($SendEmailsTo_, $EmailSubject_, $changes_)
 {
   $emailFrom = "teamcity@test.com" 
   $smtpserver="smtp.test.com" 
   $smtp=new-object Net.Mail.SmtpClient($smtpServer) 

   foreach ($email in $SendEmailsTo_.split(';'))
   {   
      $smtp.Send($emailFrom, $email, $EmailSubject_, $changes_)
   }
 }

 #get file by version number
 Function GetReleaseFileName($Version_)
 {
    $VersionFilename_ ="v";
     $Version_.split('.') | ForEach-Object{
        $VersionFilename_ +=  [System.Convert]::ToDouble($_).ToString("00"); 
    }
    $VersionFilename_ += ".sql";

     #format e.g. v12.12.00.10.sql
    return $VersionFilename_;
 }

#return if no emails added
if($SendEmailsTo.trim() -eq "") { "no emails defined!"; return;}

$VersionFilename =  GetReleaseFileName $Version;

$EmailSubject = "Release $Version database changes";
$changes = "Changes in release file $VersionFilename `r`n `r`n";
$hasChanges = 0;

if(!$GetAllChanges) {  
    (dir $ScriptFolder) | sort CreationTime -Descending |
     ForEach-Object {  
        $fileContent = get-content ($_.Directory.FullName + "\" + $VersionFilename) -Raw;

        $patterns = 'alter','drop','insert','delete','update','create'; #paterns/strings to find
        $hasChanges = 0;
        foreach ($pattern in $patterns)
        {
           $fileContent.split("`r`n") | ?  { $_ -match $pattern } | % { $changes += $_.trim() + "`r`n"; $hasChanges = 1; } 
        } 

        if($hasChanges -eq 0) { $changes += "`r`nNo database changes for release $Version !"}

        write-output $changes

        SendEmail $SendEmailsTo $EmailSubject $changes;

        break;        
    }
}
else
{
  #parse all files for all previous releases
  $EmailSubject = "All database changes";
  $changes = "All database changes: `r`n `r`n";

  (dir $ScriptFolder) | sort CreationTime -Descending |
    ForEach-Object {  
        $fileContent = get-content ($_.Directory.FullName + "\" + $_.name) -Raw;

        $patterns = 'alter','drop','insert','delete','update','create';
        $changes += "`r`nChanges in release file $_`r`n";
        $hasChanges = 0;

        foreach ($pattern in $patterns)
        {          
           if($fileContent)
           {
              $fileContent.split("`r`n") | ?  { $_ -match $pattern } | % { $changes += $_.trim() + "`r`n"; $hasChanges = 1; }  
           } 
        } 

        if($hasChanges -eq 0) { $changes += "`r`nNo database changes for release " + $_.name.Replace(".sql","").Replace("v0","");}

        $changes += "`r`n-------------------------------`r`n";      
    }

    write-output $changes 

    SendEmail $SendEmailsTo $EmailSubject $changes;
}

I have included full script sample below
release_changes_notifier

1 Star2 Stars3 Stars4 Stars5 Stars (1 votes, average: 4.00 out of 5)
Loading...Loading...

Silverlight component with chart

If you ever wanted to create your own Silverlight component, this is a good place to start. In this article I will show you how to create simple component displaying salary data on the chart.

In our example the data are being stored in the application but you can easily call a web service to display the it from the different server.

silverligt-component

After creating new silverlight project in Visual Studio we start from creating basic class structure that we will bind to our chart.

  public class NumericItemPair
    {
        public string Name { get; set; }
        public double Value { get; set; }
    }

    public class ProfessionItem
    {
        public string Name { get; set; }
        public double AVG { get; set; }
        public List<NumericItemPair> DataPoints = new List<NumericItemPair>();
    }

In our example we will get some dummy data based on user selection (drop down branch list). This data can be retrieved from database or web service. Please note that we will display aggregates based on 2 deciles; lower and upper and the median value.

  public class MyDataContext
    {
        public static ProfessionItem getData(int branch)
        {
            ProfessionItem itm = new ProfessionItem();
            if (branch == 0)
            {
                itm.AVG = 2332;
                itm.Name = "IT";
                itm.DataPoints = new List<NumericItemPair>();
                itm.DataPoints.Add(new NumericItemPair() { Name = "Lower decile", Value = 1567 });
                itm.DataPoints.Add(new NumericItemPair() { Name = "Median", Value = 1789 });
                itm.DataPoints.Add(new NumericItemPair() { Name = "Upper decile", Value = 2400 });
            }
            else if (branch == 1)
            {
                itm.AVG = 2132;
                itm.Name = "Production";
                itm.DataPoints = new List<NumericItemPair>();
                itm.DataPoints.Add(new NumericItemPair() { Name = "Lower decile", Value = 1267 });
                itm.DataPoints.Add(new NumericItemPair() { Name = "Median", Value = 1589 });
                itm.DataPoints.Add(new NumericItemPair() { Name = "Upper decile", Value = 2700 });
            }
            else
            {
                itm.AVG = 2532;
                itm.Name = "HR";
                itm.DataPoints = new List<NumericItemPair>();
                itm.DataPoints.Add(new NumericItemPair() { Name = "Lower decile", Value = 1167 });
                itm.DataPoints.Add(new NumericItemPair() { Name = "Median", Value = 1289 });
                itm.DataPoints.Add(new NumericItemPair() { Name = "Upper decile", Value = 1900 });
            }
            return itm;
        }
    }

Having done that we need to style our chart and assign bindings.

    ProfessionItem pit = MyDataContext.getData(cmbBranches.SelectedIndex);

    chart1.Title = "Branch: " + pit.Name;
    lblAVG.Content = pit.AVG.ToString("# ###") + " GBP ";

    LineSeries lineSeries = new LineSeries();
    //assign binding
    lineSeries.SetBinding(LineSeries.ItemsSourceProperty, new Binding());
    lineSeries.DependentValueBinding = new Binding("Value");
    lineSeries.IndependentValueBinding = new Binding("Name");

    // hide the legend 
    Style legendStyle = new Style(typeof(Legend));
    legendStyle.Setters.Add(new Setter(Legend.VisibilityProperty, Visibility.Collapsed));
    legendStyle.Setters.Add(new Setter(Legend.WidthProperty, 0));
    legendStyle.Setters.Add(new Setter(Legend.HeightProperty, 0));
    chart1.LegendStyle = legendStyle;

    Style titleStyle = new Style(typeof(Title));
    titleStyle.Setters.Add(new Setter(Title.ForegroundProperty, "#0004BD"));
    titleStyle.Setters.Add(new Setter(Title.FontSizeProperty, 12));
    titleStyle.Setters.Add(new Setter(Title.FontWeightProperty, "bold"));
    titleStyle.Setters.Add(new Setter(Title.HorizontalAlignmentProperty, "left"));
    chart1.TitleStyle = titleStyle;

    // hide the line series data points 
    Style datapointStyle = new Style(typeof(DataPoint));
    datapointStyle.Setters.Add(new Setter(DataPoint.VisibilityProperty, Visibility.Visible));
    datapointStyle.Setters.Add(new Setter(DataPoint.WidthProperty, 10));
    datapointStyle.Setters.Add(new Setter(DataPoint.HeightProperty, 10));
    datapointStyle.Setters.Add(new Setter(DataPoint.DependentValueStringFormatProperty, "{0:# ###} GBP"));

    lineSeries.DataPointStyle = datapointStyle;

    chart1.Series.Add(lineSeries);
    chart1.DataContext = pit.DataPoints;

Next we need to set up our xaml file to position elements within our component. We can do it manually or using Visual Studio design editor.

    <toolkit:Chart HorizontalAlignment="Left" Margin="15,0,0,346" Name="chart1"  Title="" VerticalAlignment="Bottom" Width="480" Height="370" UseLayoutRounding="True" BorderThickness="0" FontSize="11" Grid.ColumnSpan="2" Padding="10" Grid.RowSpan="2">
            <toolkit:Chart.LegendStyle >
                <Style TargetType="toolkit:Legend">
                    <Setter Property="Visibility" Value="Collapsed"/>
                </Style>
            </toolkit:Chart.LegendStyle>
            
            <!--Set X-Axis Format-->
            <toolkit:Chart.Axes>
                <toolkit:LinearAxis Orientation="Y" ShowGridLines="True" Title="Salary [GBP]" >
                    <toolkit:LinearAxis.AxisLabelStyle>
                        <Style TargetType="toolkit:AxisLabel">
                            <Setter Property="StringFormat" Value="{}{0:# ###} GBP"/>
                        </Style>
                    </toolkit:LinearAxis.AxisLabelStyle>
                </toolkit:LinearAxis>

                <toolkit:LinearAxis Orientation="X" ShowGridLines="False" Title="Salary range [%]" >
                    <toolkit:LinearAxis.AxisLabelStyle>
                        <Style TargetType="toolkit:AxisLabel">
                            <Setter Property="StringFormat" Value="{}{0:0%}"/>
                        </Style>
                    </toolkit:LinearAxis.AxisLabelStyle>
                </toolkit:LinearAxis>
            </toolkit:Chart.Axes>
        </toolkit:Chart>

After that we can test our application. I have included working example below. Happy coding 🙂

Silverlight-component

1 Star2 Stars3 Stars4 Stars5 Stars (No Ratings Yet)
Loading...Loading...

OpenXML Word templates processing

Office Open XML it’s the Microsoft’s zipped-xml based standard for processing Office documents. It allows to create, amend and process MS office files using e.g. .Net platform. In this article I will show you how to replace Word template with text and images using C# based application.

After creating new project we need to add two main references: DocumentFormat.OpenXml from DocumentFormat.OpenXml.dll and WindowsBase (.Net reference). Next, we need to prepare template with placeholders that our application will replace. For texts we will insert placeholder values in the the unique format that we can find parsing the document e.g. [#Project-Name#].

For the images we need to insert image placeholders (other images) and just remember their original names (e.g. myPicture2.jpg). This names needs to be provided in the parameter objects so we can find the placeholders by image name when parsing document.

word-template-300x184

The next step is to create parameters structure that we will use when processing the document. You may want to create your own parameters depending or your requirements.

  public class WordParameter
    {
        public string Name { get; set; }
        public string Text { get; set; }
        public FileInfo Image { get; set; }
    }

We will use them as follows when initiating the objects

    var templ = new WordTemplate();
    //add parameters
    templ.WordParameters.Add(new WordParameter() { Name = "[#Project-Name#]", Text = "Test project 123" });
    templ.WordParameters.Add(new WordParameter() { Name = "[#Features (string[])#]", Text = "Lorem Ipsum is simply dummy text of the printing \n Lorem Ipsum is simply dummy text of the printing \n Lorem Ipsum is simply dummy text of the printing..." });

    //original image names to be replaced with the new ones
    templ.WordParameters.Add(new WordParameter() { Name = "1.jpg", Image = new FileInfo(WordTemplate.GetRootPath() + @"\Images\1.jpg") });
    templ.WordParameters.Add(new WordParameter() { Name = "2.jpg", Image = new FileInfo(WordTemplate.GetRootPath() + @"\Images\2.jpg") });
    templ.WordParameters.Add(new WordParameter() { Name = "3.jpg", Image = new FileInfo(WordTemplate.GetRootPath() + @"\Images\3.jpg") });
    templ.WordParameters.Add(new WordParameter() { Name = "4.jpg", Image = new FileInfo(WordTemplate.GetRootPath() + @"\Images\4.jpg") });
    templ.WordParameters.Add(new WordParameter() { Name = "5.jpg", Image = new FileInfo(WordTemplate.GetRootPath() + @"\Images\5.jpg") });

    templ.ParseTemplate(); //create document from template

Having done that we can create our main function that parses the template and fills our placeholders with texts and images. Please see the inline comments within the function below.

 public void ParseTemplate()
 {
    using (var templateFile = File.Open(templatePath, FileMode.Open, FileAccess.Read)) //read our template
    {
        using (var stream = new MemoryStream())
        {
            templateFile.CopyTo(stream); //copy template

            using (var wordDoc = WordprocessingDocument.Open(stream, true)) //open word document
            {
                foreach (var paragraph in wordDoc.MainDocumentPart.Document.Descendants<Paragraph>().ToList()) //loop through all paragraphs 
                {
                    ReplaceImages(wordDoc, paragraph); //replace images

                    ReplaceText(paragraph); //replace text
                }

                wordDoc.MainDocumentPart.Document.Save(); //save document changes we've made
            }
            stream.Seek(0, SeekOrigin.Begin);//scroll to stream start point

            //save file or overwrite it
            var outPath = WordTemplate.GetRootPath() + @"\Output\DocumentOutput.docx";

            using (var fileStream = File.Create(outPath))
            {
                stream.CopyTo(fileStream);
            }
        }
    }
 }

Function that replaces the images. It gets all Blip objects from the paragraph and changes it’s embed ID that points to the image.

The cool thing about it is fact that you can give your own styles and transformation to the image template and it will be preserved and applied to the new image 🙂

Please see the inline comments.

 void ReplaceImages(WordprocessingDocument wordDoc, Paragraph paragraph)
 {
    // get all images in paragraph
    var imagesToReplace = paragraph.Descendants<A.Blip>().ToList();

    if (imagesToReplace.Any())
    {
        var index = 0;//image index within paragraph

        //find all original image names in paragraph
        var paragraphImageNames = paragraph.Descendants<DocumentFormat.OpenXml.Drawing.Pictures.NonVisualDrawingProperties>().ToList();

        //check all images in the paragraph and replace them if it matches our parameter
        foreach (var imagePlaceHolder in paragraphImageNames)
        {
            //check if we have image parameter that matches paragraph image
            foreach (var param in WordParameters)
            {
                //replace it if found by original image name
                if (param.Image != null && param.Image.Name.ToLower() == imagePlaceHolder.Name.Value.ToLower())
                {
                    var imagePart = wordDoc.MainDocumentPart.AddImagePart(ImagePartType.Jpeg); //add image to document
                    using (FileStream imgStream = new FileStream(param.Image.FullName, FileMode.Open))
                    {
                        imagePart.FeedData(imgStream); //feed it with data
                    }

                    var relID = wordDoc.MainDocumentPart.GetIdOfPart(imagePart); // get relationship ID

                    imagesToReplace.Skip(index).First().Embed = relID; //assign new relID, skip if this is another image in one paragraph
                }
            }
            index += 1;
        }
    }
}

When replacing the texts we check if paragraph contains the text that matches our parameter. If yes, then we check if to include one or multiple lines of text.
Next we create new parameter by copying the old parameter’s OuterXML (this preserves the styles). We also need to replace text that is stored in our parameter.

 void ReplaceText(Paragraph paragraph)
 {
    var parent = paragraph.Parent; //get parent element - to be used when removing placeholder
    var dataParam = new WordParameter();

    if (ContainsParam(paragraph, ref dataParam)) //check if paragraph is on our parameter list
    {
        //insert text list
        if (dataParam.Name.Contains("string[]")) //check if param is a list
        {
            var arrayText = dataParam.Text.Split(Environment.NewLine.ToCharArray()); //in our case we split it into lines

            if (arrayText is IEnumerable) //enumerate if we can
            {
                foreach (var itemData in arrayText)
                {
                    Paragraph bullet = CloneParaGraphWithStyles(paragraph, dataParam.Name, itemData);// create new param - preserve styles
                    parent.InsertBefore(bullet, paragraph); //insert new element
                }
            }
            paragraph.Remove();//delete placeholder
        }
        else
        {
            //insert text line
            var param = CloneParaGraphWithStyles(paragraph, dataParam.Name, dataParam.Text); // create new param - preserve styles
            parent.InsertBefore(param, paragraph);//insert new element

            paragraph.Remove();//delete placeholder
        }
    }
}

Creating the new paragraph object preserving the styles

 public static Paragraph CloneParaGraphWithStyles(Paragraph sourceParagraph, string paramKey, string text)
 {
    var xmlSource = sourceParagraph.OuterXml;

    xmlSource = xmlSource.Replace(paramKey.Trim(), text.Trim());

    return new Paragraph(xmlSource);
 }

Please note that when replacing images, the image placeholder names must be found in the document. Images that don’t match the parameter name, wont be replaced.

Having done that we can finally test our application. I have included complete working application for your tests.
WordTemplates

1 Star2 Stars3 Stars4 Stars5 Stars (No Ratings Yet)
Loading...Loading...

Finding non empty data periods T-SQL

Ever wanted to find non empty periods of data using T-SQL? I this article I will show you how to do it.
Example below shows the periods of days in which there have been at least one order. The days without orders are not being shown. This is very useful when creating advanced sales reports. Having non empty periods we can calculate additional values such as average sales in these ranges etc.

The code below simply gets all distinct dates then creates two partitions and joins them together.
In each partition the data are joined with each other using left and right join. The non null values are next being used in the final inner join.

 with temp(d) as 
 ( 
  select distinct CONVERT(date,OrderDate) d from tblOrders
 )
 select a1.id as id, a1.d as [from], a2.d as [to] from 
 ( 
   select b.d, ROW_NUMBER() over (partition by 1 order by b.d) id from temp a 
   right join temp b on dateadd(day,1,a.d) = b.d 
   where a.d is null 
 )
 a1 
 inner join  
 ( 
   select a.d, ROW_NUMBER() over (partition by 1 order by b.d) id from temp a 
   left join temp b on dateadd(day,1,a.d) = b.d 
   where b.d is null 
 ) 
 a2 on a1.id = a2.id 

sql-periods1

In order to calculate sales data in periods, simply join the final results using found dates. Hope I helped you with this sample. Happy coding 🙂

1 Star2 Stars3 Stars4 Stars5 Stars (No Ratings Yet)
Loading...Loading...