Posts

Displaying dynamic javascript charts using MVC

When creating business solutions there is often a need to display dynamic JavaScript charts using specific entity data that can be easily extended throughout the system. Properly designed system should always provide clear separation between business entities and UI layer. When using JavaScript this separation can be easily neglected.
In this article I will show you how to use entity oriented approach when mixing C# and JavaScript code.

In order to do that we will create JavaScript api that will be used to call web controllers such as clientController, productController, userController etc. Each of these controllers will provide us entity related data that can be displayed on the web pages throughout the system. The data will be sent using json protocol along with the target chart configuration we want.

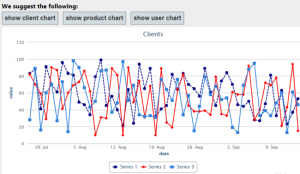
jschart_line

In order to display above charts within our application, we need to simply create div tag that will serve as a placeholder for our chart, we also need to assign attributes and “chartButton” class name to the element that will trigger chart display. The attributes will contain entity name e.g. data-entity=”client”, chart placeholder e.g. targetdiv=”chart1Div” and optionally data parameters e.g. params=”clientId=?&fullInfo=?”

  <input type="button" value="show client chart" class="chartButton" data-entity="client" data-params="clientId=@ViewBag.ClientId&fullInfo=true" data-targetdiv="chart1Div" />
  <input type="button" value="show product chart" class="chartButton" data-entity="product" data-targetdiv="chart1Div" />
  <input type="button" value="show user chart" class="chartButton" data-entity="user" data-targetdiv="chart1Div" />
  <div id="chart1Div"></div>

We also need to add following script references to our _Layout.cshtml file. In our case we will use HighCharts, hence reference to highcharts.js script (we are not limited only to this control, you can convert it to use other JavaScript chart controls as well if needed). The file chartAPI.js will contain our main logic that connects Web Api controllers and JavaScript code.

   <script src="https://code.highcharts.com/highcharts.js" type="text/javascript"></script>
   <script src="@Url.Content("~/Scripts/chartAPI.js")" type="text/javascript"></script>

Let’s start implementation from creating Web Api entity controllers and chart data dto object that will transfer the chart data and it’s configuration.

The ChartData class will contain chart series and chartConfig object – it can be extended at any time depending on our requirements.

   public class ChartData
   {
        public ChartConfig ChartConfig { get; set; }
        public List<Series> Series { get; set; }
    }

    public class Series
    {
        public string Name { get; set; }
        public string Color { get; set; }
        public string DashStyle { get; set; }      
        public List<PointData> Points { get; set; }
    }

    public class PointData
    {
        public DateTime Date { get; set; }
        public double Value { get; set; }
    }

    public class ChartConfig
    {
        public ChartConfig()
        {
            tooltipPointFormat = "";
        }

        public string chartTitle { get; set; }
        public string defaultSeriesType { get; set; }
        public int width { get; set; }
        public int height { get; set; }
        public string tooltipPointFormat { get; set; }
        public bool pie_allowPointSelect { get; set; }
        public bool pie_dataLabelsEnabled { get; set; }
        public bool pie_showInLegend { get; set; }   
    }

Having above classes created, we can now use it to fill it with dummy data inside our entity controller. We can add as many series as we like, we may also configure desired chart’s width, height, series colors etc. Please note that controller’s method will be mapped based on defined html params (see above html configuration).

 public string Get(int clientId, bool fullInfo = true)
 { 
    var data = new ChartData();

    //configure chart
    data.ChartConfig = new ChartConfig()
    {
        chartTitle = "Clients",
        defaultSeriesType = "line",
        width = 800,
        height = 400,
    };

    #region add series
    data.Series = new List<Series>();

    data.Series.Add(new Series()
    {
        Name = "Series1",
        Color = ColorTranslator.ToHtml(Color.Navy),
        DashStyle = "ShortDash",
        Points = new List<PointData>()
    });

    data.Series.Add(new Series()
    {
        Name = "Series2",
        Color = ColorTranslator.ToHtml(Color.Red),
        Points = new List<PointData>()
    });

    data.Series.Add(new Series()
    {
        Name = "Series3",
        Points = new List<PointData>()
    });

    #endregion

    #region add dummy data
    var random = new Random();
    foreach (var serie in data.Series)
    {
        for (var i = 0; i < 50; i++)
        {
            serie.Points.Add(new PointData()
            {
                Date = DateTime.Now.AddDays(-i),
                Value = random.Next(10, 100)
            });
        }
    }
    #endregion

    var json = JsonHelper.ToJSON<ChartData>(data);

    return json;
}

Our chartAPI.js file will contain main JavaScript logic encapsulating data retrieval and constructing the chart object. The function getEntityData simply calls appropriate entity controller using $.getJSON function. When data is retrieved, the renderChart function is used to create chart object, fill it with data and configure according to obtained configuration.

 //this function is used by UI to trigger chart display
$(document).ready(function () {
    //process data on button click
    $(".chartButton").click(function (sender) {

        //read button attributes
        var entity = $(this).attr("data-entity");
        var targetDiv = $(this).attr("data-targetDiv");
        var params = $(this).attr("data-params");

        //call encapsulated function
        getEntityData(entity, params, function (data, status, response) {
            if (status === "success") {
                renderChart(data, targetDiv);
            }
            else if (status === "error") {
                //process the error here if needed

                alert('An error occurred: ' + response);
            }
            else if (status === "complete") {
                //attach your load completed events here if needed

                //alert('Data loaded!');
            }
        });
    });
});

//Gets data for the entity
//This function is encapsulated 
function getEntityData(entityName, params, callbackFn) {
    if (typeof callbackFn != 'function') {
        alert('Incorrect callback function attached!'); return;
    }

    //make sure correct path is set
    var root = location.protocol + "//" + location.host;

    $.getJSON(root + '/API/' + entityName + "?" + params, null)
    .success(function (data, status, response) {
        //create object from json
        var resultObject = JSON.parse(data);
        callbackFn(resultObject, status, response);
    })
    .error(function (e, status, response) {
        callbackFn(e, status, response);
    })
    .complete(function (e, status, response) {
        callbackFn(e, "complete", response);
    });
}

//Renders chart
function renderChart(data, renderTo) {
    var chart1 = new Highcharts.Chart({
        chart: {
            renderTo: renderTo,
            defaultSeriesType: data.ChartConfig.defaultSeriesType,
            width: data.ChartConfig.width,
            height: data.ChartConfig.height,
        },
        title: {
            text: data.ChartConfig.chartTitle,
        },
        tooltip: {
         pointFormat: data.ChartConfig.tooltipPointFormat,
        },
        plotOptions: {
                pie: {
                    allowPointSelect: data.ChartConfig.pie_allowPointSelect,
                    cursor: 'pointer',
                    dataLabels: {
                        enabled: data.ChartConfig.pie_dataLabelsEnabled,
                    },
                    showInLegend: data.ChartConfig.pie_showInLegend,
                },
            },
        xAxis: {
            title: {
                text: 'date'
            },
            type: 'datetime',
        },
        yAxis: {
            title: {
                text: 'value'
            }
        },
    });

    $.each(data.Series, function (index, item) {
        //add series
        chart1.addSeries({
            name: item.name,
            dashStyle: item.DashStyle,
            color: item.Color,
            data: []
        }, false);

        //add data points
        $.each(item.Points, function (index, pointData) {
            chart1.series[chart1.series.length - 1].addPoint([
                Date.parse(new Date(parseInt(pointData.Date.substr(6)))),//format date
                pointData.Value,
            ], false);
        });
    });

    chart1.redraw();
}

It is more than certain that you will have to adjust above solution to your specific requirements. At the same time it should give you a good starting point to implement your own solution based on this example.

I have attached project files below for your convenience.

jsChartMVC

1 Star2 Stars3 Stars4 Stars5 Stars (1 votes, average: 4.00 out of 5)
Loading...Loading...

Displaying interactive MS Chart objects in ASP.NET MVC

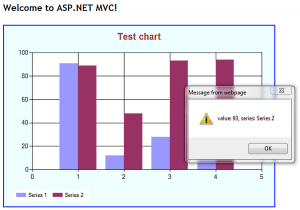
Displaying charts using MS Chart is usually simple in asp.net webform. The problem exists if we want to use it in Asp.net MVC application without putting it on .aspx page. In this article I will show you how to display interactive chart using purely MVC view.

mschart_mvc

Lets start with creating ChartHelper class that will contain basic logic for creating chart objects. In the function CreateDummyChart() we will just create standard MS Chart object with some dummy data.

 public static Chart CreateDummyChart()
 {
    var chart = new Chart() { Width = 600, Height = 400 };
    chart.Palette = ChartColorPalette.Excel;
    chart.Legends.Add(new Legend("legend1") { Docking = Docking.Bottom });

    var title = new Title("Test chart", Docking.Top, new Font("Arial", 15, FontStyle.Bold), Color.Brown);
    chart.Titles.Add(title);
    chart.ChartAreas.Add("Area 1");

    chart.Series.Add("Series 1");
    chart.Series.Add("Series 2");

    chart.BackColor = Color.Azure;
    var random = new Random();
    
    //add random data: series 1
    foreach (int value in new List<int>() { random.Next(100), random.Next(100), random.Next(100), random.Next(100) })
    {
        chart.Series["Series 1"].Points.AddY(value);

        //attach JavaScript events - it can also be ajax call
        chart.Series["Series 1"].Points.Last().MapAreaAttributes = "onclick=\"alert('value: #VAL, series: #SER');\"";
    }

    //add random data: series 2
    foreach (int value in new List<int>() { random.Next(100), random.Next(100), random.Next(100), random.Next(100) })
    {
        chart.Series["Series 2"].Points.AddY(value);

        //attach JavaScript events - it can also be ajax call
        chart.Series["Series 2"].Points.Last().MapAreaAttributes = "onclick=\"alert('value: #VAL, series: #SER');\"";
    }

    return chart;
 }

Next, we need to create function that takes our newly created chart object and saves it to memory stream. After that we only need to convert the stream to byte array and to base64 string afterwards.

Having image string created, we simply construct html “img” tag to be rendered by our view. Please note that “data:image/png;base64” attributes are necessary to tell the browser to render it as image.

 public static string GetChartImageHtml(Chart chart)
 {
    using (var stream = new MemoryStream())
    {
        var img = "<img src='data:image/png;base64,{0}' alt='' usemap='#" + ImageMap + "'>";

        chart.SaveImage(stream, ChartImageFormat.Png);

        var encoded = Convert.ToBase64String(stream.ToArray());

        return string.Format(img, encoded);
    }
 }

The final thing is to create DisplayChart() method in the view to be used by Html.RenderAction. Apart from chart’s image string, we also need to display chart’s image map in order to enable chart JavaScript events when needed.

public ActionResult DisplayChart()
{  
    var chart = ChartHelper.CreateDummyChart();
   
    var result = new StringBuilder();
    result.Append(ChartHelper.GetChartImageHtml(chart));
    result.Append(chart.GetHtmlImageMap(ChartHelper.ImageMap));

    return Content(result.ToString());
}

And finally this is our view

@{
    ViewBag.Title = "Home Page";
}

<h2>@ViewBag.Message</h2>

@{ Html.RenderAction("DisplayChart"); }

I have attached project files to save your time 🙂

mschart-mvc

1 Star2 Stars3 Stars4 Stars5 Stars (No Ratings Yet)
Loading...Loading...

jQuery advanced selector and filter methods

Jquery it’s a powerful framework that allows us to apply advanced client side selectors and filters using elegant and readable code. Basic selectors can be applied using following method: $(‘tr’). If we want to apply an filter to our results we can use it like that: $(‘tr:eq(1)’) which gets first tr element with the index 1.

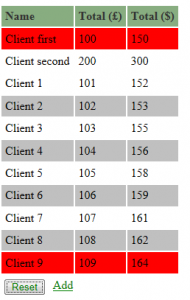
Lets create an example with the table that has currency values we want to convert.

jquery-selectors

In our example we add styles to our existing table, next we set the first row color to red. Next, we append 9 more rows with some values. Next, we give gray color to the even rows with index greater than 1 $(‘tr:even:gt(1)’). After that we set the last row color to be equal the first one (non header row).

Next step is to convert each row value from pounds to dollars using each function. After that we set some styles to the button with value “Reset” and link with text “Add”.

At the end we catch the submit event and display the hidden form value in the confirmation dialog. See the in-line comments below.

 $(document).ready(function () {
    //set the table css
    $('table').addClass('myTable');

    //set first row color to red (after header)
    $('tr:eq(1)').css('background-color', 'red');

    //add some rows to table
    for (var i = 1; i < 10; i++) {
        $('table').append("<tr><td>Client " + i + "</td><td>" + 10 + i + "</td></tr>");
    }

    //set even row background color (with index more than 1)
    $('tr:even:gt(1)').css('background-color', 'silver');

    //set backround of last row to be same as the first row (non header)
    $('tr:last').css('background-color', $('tr:eq(1)').css('background-color'))

    //insert after second child
    $('th:nth-child(2)').text('Total (£)').after('<th>Total ($)</th>');

    //convert each value after second child for each row
    $('td:nth-child(2)').after('<td/>').each(function () {
        $(this).next().text((parseInt($(this).text()) * 1.5).toFixed(0));
    });

    //find the button with value reset and link with text add and give it some styles
    $(':submit[value="Reset"], a:contains("Add")').css('float', 'left').css('margin', '5px').css('color', 'green');

    //catch the submit action and read hidden value
    $('form[action$="/Reset"]').submit(function () {
        var summitName = $(':hidden', this).attr('value');
        return confirm('Are you sure you want to Reset ' + summitName + ' ?');
    });

});

Included sample it’s barely an tip of the iceberg of what we can achieve with jQuery. Please read jQuery documentation if you need more information on this topic. I have included working example below for your tests.
jQuery-selectors-filters

1 Star2 Stars3 Stars4 Stars5 Stars (No Ratings Yet)
Loading...Loading...

Database driven rotating image gallery with jQuery

When building database driven websites sometimes there is a need to display image gallery based on pictures stored in database. Good solution for that is to combine jQuery scripts with asp.net controls. Today I will show you how to build simple database driven gallery with auto rotating pictures.

picture-gallery

In our example the pictures will be stored in application folder, we will only get picture urls from db.

Let’s start with creating simple asp.net website with the default.aspx page. Next we will create Photos class and bind it to the asp.net data list view control.

 public partial class gallery_Default : System.Web.UI.Page
 {
    public List<Photo> Photos = new List<Photo>();// our data source
    //our custom picture class
    public class Photo
    {
        public string Name { get; set; }
        public string Path { get; set; }
        public bool IsDefault { get; set; }
    }

    protected void Page_Load(object sender, EventArgs e)
    {
        if (!IsPostBack)
        {
            //get it from database
            Photos.Add(new Photo() { IsDefault = true, Name = "photo1", Path = "~/images/1.jpg" });
            Photos.Add(new Photo() { Name = "photo2", Path = "~/images/2.jpg" });
            Photos.Add(new Photo() { Name = "photo3", Path = "~/images/3.jpg" });
            Photos.Add(new Photo() { Name = "photo4", Path = "~/images/4.jpg" });
            Photos.Add(new Photo() { Name = "photo5", Path = "~/images/5.jpg" });
            Photos.Add(new Photo() { Name = "photo6", Path = "~/images/6.jpg" });
            /////////////

            gridList.DataSource = Photos;
            gridList.DataBind();
        }
    }
 }

In the page markup we create following structure

  <div class="gallery">
        <div class="thumb-image-frame">
            <span class="thumb-image-wrapper">
                <img id='thumb-large-image' alt="" />
            </span>
        </div>
        <div class="list">
            <asp:ListView runat="server" ID="gridList">
                <LayoutTemplate>
                    <ul class="thumb-list">
                        <asp:PlaceHolder runat="server" ID="itemPlaceHolder" />
                    </ul>
                </LayoutTemplate>
                <ItemTemplate>
                    <li>
                        <a class="thumb-link">
                            <img class="thumb-image" src='<%# ResolveUrl(Eval("Path").ToString()) %>' alt="" title='<%# Eval("Name") %>' />
                        </a>
                    </li>
                </ItemTemplate>
            </asp:ListView>
        </div>
    </div>

Next we need to create jQuery script that will run when page loads. In our example, slides start to rotate with the 5 seconds intervals. Rotating stops when user’s cursor enters the thumbnail area and resumes on mouseleave event. You can configure below script to suit your needs.

 var run = true; //init state rotate or not
 var rotateDelay = 5000; //in milliseconds
 /////////
 var all = 0;
 var c = 1;

$(document).ready(function () {
    $("a.thumb-link").click(thumbClicked);
    $("ul.thumb-list").children("li").first().find("a.thumb-link").click();

    // rotate calls
    $("ul.thumb-list").mouseenter(stopRotate).mouseleave(startRotate); //stop/start rotating on mouse enter/ leave (thumb list)
    all = $("ul.thumb-list").children("li").length; //get total images count

    if (all > 1) { setInterval('Rotate()', rotateDelay); } //if more than one picture start rotating
});

function thumbClicked() {
    var imageSource = $(this).find("img.thumb-image").attr("src");
    $("#thumb-large-image").fadeOut("fast", function () {
        $("#thumb-large-image").attr("src", imageSource);// switch the picture
        $("#thumb-large-image").fadeIn("fast");
    });

    $("ul.thumb-list").children("li").removeClass("selected");
    $(this).parent("li").addClass("selected");//select current thumb
}

function stopRotate() { run = false; }

function startRotate() { run = true; }

function Rotate() {
    if (!run) { return; }//return if turned off
    if (c >= all) { c = 0; } //reset if last picture

    var cnt = 0;
    $("ul.thumb-list").children("li").each(function () {
        if (cnt == c) {
            var el = $(this);
            el.find("a.thumb-link").click();
        }
        cnt = cnt + 1;
    });

    c = c + 1;
 };

At the end we only need to set some css styles for the gallery and we are ready to test it.

 ul.thumb-list { width: 400px; padding:0px; }
 ul.thumb-list li { display:inline-block;  }
 ul.thumb-list li a.thumb-link { display: inline-block; cursor: pointer; }
 ul.thumb-list li a.thumb-link img.thumb-image { width: 110px; height: 90px; padding: 7px; border: 2px  solid white;border-radius: 8px; }
 ul.thumb-list li.selected a.thumb-link img.thumb-image { border-color: #df7777;}
 .thumb-image-frame { width: 400px; min-width: 400px; height: 300px; min-height: 300px; text-align: center; margin-bottom: 10px; }
 .thumb-image-wrapper { line-height: 300px; }
 #thumb-large-image { height: 300px; min-height: 300px; width: 400px; min-width: 400px; vertical-align: middle;border-radius: 8px;}

As you can see creating custom image gallery is quite easy to do using jQuery and asp.net. You can of course create variety of additional functions to it e.g. animations when switching the pictures, custom play and pause menu etc.

I have included working example below. Feel free to adjust it to your needs.

jquery-gallery

1 Star2 Stars3 Stars4 Stars5 Stars (No Ratings Yet)
Loading...Loading...

Using Html5 Local storage on mobile devices

In many situations there is a need to store something on the mobile device that can be later retrieved and reused. Typical situation is the offline state where device suddenly loosing internet connection.

To solve this problem we can use HTML5 local storage. It works on all mobile devices with the most popular browsers. Additionally, unlike the cookies the values are not being transmitted from device to the server on each request. They are also persistent across the pages.

In our example we will assume that user sends timesheet data from his mobile device (the files are running locally on the device).
When user sends the data, we store it in local storage trying to send it. If sending is not successful, we keep it in the storage. We also check if we can send the data every time user posts the new form.

 //when DOM is ready
 $(document).ready(function () {

    //try to post saved data every time someone loads page (silent mode)
    trySaveOfflineData(true);

    //if someone saved the form
    var id = getUrlVars()["UserID"];
 
    if (id != null) {
        
        //save in local storage first
        saveData();

        //post local storage data data
        trySaveOfflineData(false);
    }
});

We also need to check if local storage is supported on the mobile device.

 function supportsLocalStorage() {
    //check if device supports local storage
    try {
        return 'localStorage' in window && window['localStorage'] !== null;
    } catch (e) {
        return false;
    }
}

When user saves the data we simply read the values and concatenate it to the single string object. We will read this values later using generic handler in our standard asp.net application located on the remote server.

 function saveData() {
    //read url params from submitted form (we can also use post method instead)
    var userID = getUrlVars()["UserID"];
    var name = getUrlVars()["Name"];
    var comments = getUrlVars()["Comments"];
    var hours = getUrlVars()["Hours"];
    var overtime = getUrlVars()["Overtime"];
    var job = getUrlVars()["Job"];

    var idKey = 'timesheet.' + userID;//set the unique key making sure it belongs to us
    var obj = userID + "|" + name + "|" + comments + "|" + hours + "|" + overtime + "|" + job;

    //save object in local storage
    localStorage.setItem(idKey, obj);

    return true;
}

Every time user loads the page we read values from the local storage and try to post it to our web application. If he gets internet connection we should be able to push our storage data to the server.

 function trySaveOfflineData(silent) {
    // check all keys in local storage
    for (var key in localStorage) {
        
        //check if it our data
        if (key.search('timesheet.') >= 0) {

            var dataObj = localStorage[key]; // get object

            //post it to the server
            postData(SERVER_URL, dataObj, silent);

            //delete item from local storage
            localStorage.removeItem(key);
        }
    }
}

When posting the data we simply use Jquery post method. Next, we read the response from the server as a string and display messages if necessary.

 function postData(url, dataObj, silent) {
    //use Jquery post and send object as a param timesheetObj
    $.post(url, { timesheetObj: dataObj },
                             //get response
                             function (data) {
                                 if (data == "OK") {
                                     if (!silent) { alert("Data has been sent!"); }
                                     return;
                                 }
                                 //if not supports local storage display warning
                                 if (!supportsLocalStorage()) {
                                     if (!silent) { alert("offline mode not supported!"); }
                                     return;
                                 }
                                 //if we got here - it has to be an error 🙂
                                 if (!silent) { alert("Error occurred: " + data); }
                             });
 }

On the server side we use generic handler to process the request. We also need to set headers to avoid Cross-site HTTP request errors.

  public void ProcessRequest(HttpContext context)
  {
        // this is to avoid following error: XMLHttpRequest cannot load https://localhost:58017/WebSite/send.ashx. 
        // Origin https://localhost:58078 is not allowed by Access-Control-Allow-Origin.
        context.Response.AppendHeader("Access-Control-Allow-Origin", "*");  
        context.Response.ContentType = "text/plain";

        try
        {
            var data = context.Request["timesheetObj"];
            var timesheet = data.Split('|');

            var userID = timesheet[0];
            var name = timesheet[1];
            var comments = timesheet[2];
            var hours = timesheet[3];
            var overtime = timesheet[4];
            var job = timesheet[5];
            
            //check and save the data here

        }
        catch (Exception ex)
        {
            context.Response.Write(ex.Message); return;
        }

        context.Response.Write("OK");
    }

Solution I described it’s just a test sample that needs to be converted using PhoneGap before going into production. PhoneGap simply wraps html elements to get desired look on the device. We would also need to apply security measures to avoid fake or duplicated requests etc.

In general I this this is good alternative to creating mobile solution that works only on one platform.

I have included working example below for you tests. Happy coding 🙂
Html5-LocalStorage

1 Star2 Stars3 Stars4 Stars5 Stars (No Ratings Yet)
Loading...Loading...