Displaying dynamic javascript charts using MVC
When creating business solutions there is often a need to display dynamic JavaScript charts using specific entity data that can be easily extended throughout the system. Properly designed system should always provide clear separation between business entities and UI layer. When using JavaScript this separation can be easily neglected.
In this article I will show you how to use entity oriented approach when mixing C# and JavaScript code.
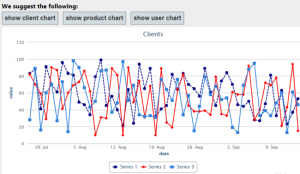
In order to do that we will create JavaScript api that will be used to call web controllers such as clientController, productController, userController etc. Each of these controllers will provide us entity related data that can be displayed on the web pages throughout the system. The data will be sent using json protocol along with the target chart configuration we want.
In order to display above charts within our application, we need to simply create div tag that will serve as a placeholder for our chart, we also need to assign attributes and “chartButton” class name to the element that will trigger chart display. The attributes will contain entity name e.g. data-entity=”client”, chart placeholder e.g. targetdiv=”chart1Div” and optionally data parameters e.g. params=”clientId=?&fullInfo=?”
  <input type="button" value="show client chart" class="chartButton" data-entity="client" data-params="clientId=@ViewBag.ClientId&fullInfo=true" data-targetdiv="chart1Div" />
  <input type="button" value="show product chart" class="chartButton" data-entity="product" data-targetdiv="chart1Div" />
  <input type="button" value="show user chart" class="chartButton" data-entity="user" data-targetdiv="chart1Div" />
  <div id="chart1Div"></div>
We also need to add following script references to our _Layout.cshtml file. In our case we will use HighCharts, hence reference to highcharts.js script (we are not limited only to this control, you can convert it to use other JavaScript chart controls as well if needed). The file chartAPI.js will contain our main logic that connects Web Api controllers and JavaScript code.
   <script src="https://code.highcharts.com/highcharts.js" type="text/javascript"></script>
   <script src="@Url.Content("~/Scripts/chartAPI.js")" type="text/javascript"></script>
Let’s start implementation from creating Web Api entity controllers and chart data dto object that will transfer the chart data and it’s configuration.
The ChartData class will contain chart series and chartConfig object – it can be extended at any time depending on our requirements.
   public class ChartData
   {
        public ChartConfig ChartConfig { get; set; }
        public List<Series> Series { get; set; }
    }

    public class Series
    {
        public string Name { get; set; }
        public string Color { get; set; }
        public string DashStyle { get; set; }
        public List<PointData> Points { get; set; }
    }

    public class PointData
    {
        public DateTime Date { get; set; }
        public double Value { get; set; }
    }

    public class ChartConfig
    {
        public ChartConfig()
        {
            tooltipPointFormat = "";
        }

        public string chartTitle { get; set; }
        public string defaultSeriesType { get; set; }
        public int width { get; set; }
        public int height { get; set; }
        public string tooltipPointFormat { get; set; }
        public bool pie_allowPointSelect { get; set; }
        public bool pie_dataLabelsEnabled { get; set; }
        public bool pie_showInLegend { get; set; }
    }
Having above classes created, we can now use it to fill it with dummy data inside our entity controller. We can add as many series as we like, we may also configure desired chart’s width, height, series colors etc. Please note that controller’s method will be mapped based on defined html params (see above html configuration).
 public string Get(int clientId, bool fullInfo = true)
 {
    var data = new ChartData();

    //configure chart
    data.ChartConfig = new ChartConfig()
    {
        chartTitle = "Clients",
        defaultSeriesType = "line",
        width = 800,
        height = 400,
    };

    #region add series
    data.Series = new List<Series>();

    data.Series.Add(new Series()
    {
        Name = "Series1",
        Color = ColorTranslator.ToHtml(Color.Navy),
        DashStyle = "ShortDash",
        Points = new List<PointData>()
    });

    data.Series.Add(new Series()
    {
        Name = "Series2",
        Color = ColorTranslator.ToHtml(Color.Red),
        Points = new List<PointData>()
    });

    data.Series.Add(new Series()
    {
        Name = "Series3",
        Points = new List<PointData>()
    });

    #endregion

    #region add dummy data
    var random = new Random();
    foreach (var serie in data.Series)
    {
        for (var i = 0; i < 50; i++)
        {
            serie.Points.Add(new PointData()
            {
                Date = DateTime.Now.AddDays(-i),
                Value = random.Next(10, 100)
            });
        }
    }
    #endregion

    var json = JsonHelper.ToJSON<ChartData>(data);

    return json;
}
Our chartAPI.js file will contain main JavaScript logic encapsulating data retrieval and constructing the chart object. The function getEntityData simply calls appropriate entity controller using $.getJSON function. When data is retrieved, the renderChart function is used to create chart object, fill it with data and configure according to obtained configuration.
 //this function is used by UI to trigger chart display
$(document).ready(function () {
    //process data on button click
    $(".chartButton").click(function (sender) {

        //read button attributes
        var entity = $(this).attr("data-entity");
        var targetDiv = $(this).attr("data-targetDiv");
        var params = $(this).attr("data-params");

        //call encapsulated function
        getEntityData(entity, params, function (data, status, response) {
            if (status === "success") {
                renderChart(data, targetDiv);
            }
            else if (status === "error") {
                //process the error here if needed

                alert('An error occurred: ' + response);
            }
            else if (status === "complete") {
                //attach your load completed events here if needed

                //alert('Data loaded!');
            }
        });
    });
});

//Gets data for the entity
//This function is encapsulated
function getEntityData(entityName, params, callbackFn) {
    if (typeof callbackFn != 'function') {
        alert('Incorrect callback function attached!'); return;
    }

    //make sure correct path is set
    var root = location.protocol + "//" + location.host;

    $.getJSON(root + '/API/' + entityName + "?" + params, null)
    .success(function (data, status, response) {
        //create object from json
        var resultObject = JSON.parse(data);
        callbackFn(resultObject, status, response);
    })
    .error(function (e, status, response) {
        callbackFn(e, status, response);
    })
    .complete(function (e, status, response) {
        callbackFn(e, "complete", response);
    });
}

//Renders chart
function renderChart(data, renderTo) {
    var chart1 = new Highcharts.Chart({
        chart: {
            renderTo: renderTo,
            defaultSeriesType: data.ChartConfig.defaultSeriesType,
            width: data.ChartConfig.width,
            height: data.ChartConfig.height,
        },
        title: {
            text: data.ChartConfig.chartTitle,
        },
        tooltip: {
         pointFormat: data.ChartConfig.tooltipPointFormat,
        },
        plotOptions: {
                pie: {
                    allowPointSelect: data.ChartConfig.pie_allowPointSelect,
                    cursor: 'pointer',
                    dataLabels: {
                        enabled: data.ChartConfig.pie_dataLabelsEnabled,
                    },
                    showInLegend: data.ChartConfig.pie_showInLegend,
                },
            },
        xAxis: {
            title: {
                text: 'date'
            },
            type: 'datetime',
        },
        yAxis: {
            title: {
                text: 'value'
            }
        },
    });

    $.each(data.Series, function (index, item) {
        //add series
        chart1.addSeries({
            name: item.name,
            dashStyle: item.DashStyle,
            color: item.Color,
            data: []
        }, false);

        //add data points
        $.each(item.Points, function (index, pointData) {
            chart1.series[chart1.series.length - 1].addPoint([
                Date.parse(new Date(parseInt(pointData.Date.substr(6)))),//format date
                pointData.Value,
            ], false);
        });
    });

    chart1.redraw();
}
It is more than certain that you will have to adjust above solution to your specific requirements. At the same time it should give you a good starting point to implement your own solution based on this example.
I have attached project files below for your convenience.


 (1 votes, average: 4.00 out of 5)


